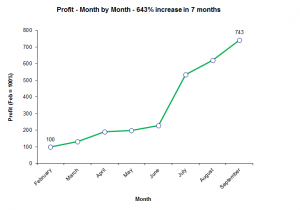
The point of this case study is to show how working ‘both sides of the click’ multiplies profits – in this case, a 643% increase in profit over 7 months. It also shows how to tackle a poorly optimised account.
Due to confidentiality, this case study doesn’t contain sensitive data about the client.
Also, because they are a well-known company, they get a lot of searches for their brand name.
I’ve excluded that data from the case study as, although the profit from brand searches increased by over 30% – due to increased ctr and conversion rate – there are far fewer opportunities for PPC optimisation when it comes to brand searches.
A Bit of Background
The client is a well-established online business. They started using PPC in late 2005 and had used at least 2 different PPC agencies prior to hiring me in early 2013.
So it’s important to understand I was optimising a long-standing professional campaign, rather than a new account or D-I-Y campaign.
Month 1 (March 2013)
I started by asking the client what a conversion was worth. Using that data, I could see the cost per conversion was 79% of the value of a conversion. Or, to put it another way, they would spend £1 and get back £1.26 – a profit of 26%.
That’s not particularly bad in a competitive market but, as you’ll see, after 7 months, it was increased to 89%.
When I took over, the campaign was poorly structured. There were a number of campaigns, some of which had hundreds of active ad groups – one had 477. These ad groups overlapped to the point where there was no way to know which ad group would be triggered by a particular search.
The previous managers had used bid management software. As a result, the bids varied hugely within ad groups. And, looking at historic data, the differences in bids didn’t reflect the differences in ROI of different keywords.
My first step was to simplify the account so it was clear which ad group would show for any particular search (using negative keywords).
Each resultant ad group – and there were around 90 of them – was tightly themed around one keyword idea. I also split ad groups into (a) phrase + exact match, and (b) broad match.
I used historic search query reports to estimate cost per conversion per ad group – and set the bids accordingly. All bids were set at ad group level, rather than keyword level – i.e. every keyword within an ad group had the same bid.
Doing that meant I could get a clear picture of the ROI for different keyword themes – and how that varied across different match types.
Finally, I also deleted some obviously losing ads.
The result: the spend decreased 11%, conversions dropped 1.5%, cost per conversion dropped 9%, profit per £1 increased to 39p. Profit in month 1 was 33% higher than when I started.
Because these changes took some time to implement, we didn’t get the full value of these in month 1 – so the real level of improvement was greater than 33%.
Month 2 (April 2013)
This was mainly a continuation of the work done in month 1. As data came in, I continued to adjust bids, delete losing ads, write new ads, and break up ad groups where appropriate.
One thing that’s worth addressing at this point is that, if your ad shows on the left, you’ll get 10-20 times the clickrate you get if your ad shows on the right.
So my goal was to find the balance between being on the left and getting the maximum number of clicks versus maximising the profit per conversion. It’s often wise to accept a much lower profit per conversion in order to bid higher and get 15x as many visitors.
Month 2 results: the spend increased 42% month-on-month, but that resulted in 42% more conversions. Profit per £1 increased slightly to 40p. Profit in month 2 was 91% higher than when I started.
Month 3 (May 2013)
This month saw a continuation of the work above, but I also started looking at the landing pages being used. I felt I could improve on them, so I wrote a new page that went live at the end of May.
This page was tested in the 15 highest-volume ad groups. Ultimately, it averaged around 20% higher conversion rate but, as you’ll see, that didn’t start paying off until June.
Month 3 results: Due to (mainly) ad split-testing, profit increased to 99% higher than when I started.
Month 4 (June 2013)
The ‘normal PPC work’ continued. But we started to see higher conversion rates due to the impact of the new landing page. (Remember it was only running in 15 ad groups and half the time – the other half, ads with the old landing pages were being shown.)
Month 4 results: The success of the previous month’s work meant I could increase bids. As a result, the spend went up 21% month-on-month, conversions were up 19%, profit was up 128% compared to when I started.
By this point we were getting 66% more conversions per month than in February. Our cost per conversion was down 10%. So, although spend was up 50%, profits were up by 128%.
This is what happens when your campaigns become more effective: you can bid for higher ad positions, and still make more profit per conversion.
Month 5 (July 2013)
As you’ll see from the chart at the beginning of the article, this is when the landing page really started paying off.
I initially tested it in 15 ad groups. By now, it had proven itself superior in most of these ad groups – meaning all the traffic in those groups was going to this higher converting page. And I’d rolled out the test to more and more ad groups.
Month 5 results: As a result of this, the cost per conversion was 30% lower than when I started. Or, to put it another way, instead of paying £1 to get back £1.26, we were paying £1 to make £1.80.
Because we were now so competitive, we were bidding for ever-higher ad positions – our spend was 76% higher than when I started.
In return for this extra money, we had 150% more conversions and a 434% higher profit!
This is the benefit of combining effective pay per click management and landing page optimisation.
Months 6 and 7 (August and September 2013)
There were no new landing pages during this time, but I did continue to roll out the landing page from late May.
I was also continuing to split-test ads, tweak bids, add the occasional new keyword idea (hard to find when you start with an account that’s over 7 years old), adding negative keywords.
However, as you’ll see from the chart, profit continued to increase: +521% in August, +643% in September.
By the end of September, things looked like this:
| February v September | |
| Difference % | |
| Clicks | 112 |
| Impressions | 59 |
| Ctr | 33 |
| Cost/click | 4 |
| Cost | 121 |
| Conversions | 232 |
| Conv rate | 57 |
| Cost / conv | -33 |
| Profit/conv % | 126 |
| Total Conv Value | 232 |
| Profit | 643 |
| Profit per £ spent | 239 |
As you can see, spend increased by 121%, but that resulted in 232% more sales.
All of this was made able by lowering the cost per conversion. By cutting that by 1/3, we ended making 126% more per conversion. That allowed us to bid more and get higher ad positions.
This is what I called working “both sides of the click”: using conversion rate optimisation to enable you to bid more. That gives you more impressions, higher ctr, more conversions etc… to a far greater extent than if you just worked on the PPC account.
Of course, I coupled that with account optimisation. So the gains from both sides multiplied like compound interest and gave the 643% increase in profit we wouldn’t have achieved if we’d only done PPC work, or only done conversion rate optimisation.
Steve Gibson